
Quant Trading for Programmers 12: Final Return Is Not Enough
Quant Trading for Programmers 12: Final Return Is Not Enough
Article 11 added a multi-symbol portfolio backtest. If we only look at final_equity now, it is easy to misjudge a strategy.
High final return may hide deep drawdowns. A high win rate may still mean small wins and large losses. Too few trades may mean the result is just accidental. Article 12 turns these ideas into a reusable set of backtest metrics.
Metrics Are The Language Of Strategy Review
Backtest metrics are not decorative chart labels.
When two strategies differ, we need to know where the difference comes from: return, volatility, drawdown, trading frequency, win rate, or profit-loss ratio.
Common metrics can first be grouped by the questions they answer:
| Metric | Main question |
|---|---|
| Total return / annualized return | How much did it make, and what is the rough yearly equivalent? |
| Annualized volatility | Was the path stable, or did return come from heavy fluctuation? |
| Max drawdown | How much did the strategy lose from peak to trough? |
| Win rate | What percentage of closed trades made money? |
| Profit-loss ratio | How large are average winning trades relative to average losing trades? |
| Turnover | Is the strategy trading too frequently? |
No single metric decides whether a strategy is good. In real reviews, they are read together. High return with deep drawdown may not fit a real account. High win rate with poor profit-loss ratio may be small-win-large-loss behavior. High turnover with ordinary return can become unrealistic once fees and slippage are added.
Add A Metrics Object
Chapter 12 adds app/performance_metrics.py.
@dataclass(frozen=True)
class PerformanceMetrics:
    total_return: float
    annualized_return: float
    annualized_volatility: float
    sharpe_like: float | None
    max_drawdown: float
    win_rate: float | None
    profit_loss_ratio: float | None
    trade_count: int
    turnover: float
The field is called sharpe_like, not strict textbook Sharpe. The current implementation does not include a risk-free rate input. It simply divides annualized return by annualized volatility, which is acceptable as an early engineering comparison metric.
Compute Returns From The Equity Curve
The equity curve is first converted into daily returns:
def equity_returns(equity_curve: Iterable[dict[str, object]]) -> list[float]:
    values = [float(row["equity"]) for row in equity_curve]
    out: list[float] = []
    for previous, current in zip(values, values[1:], strict=False):
        if previous:
            out.append(round(current / previous - 1, 8))
    return out
With daily returns, annualized volatility is the sample standard deviation multiplied by sqrt(252):
variance = sum((value - mean) ** 2 for value in returns) / (len(returns) - 1)
return round(math.sqrt(variance * 252), 6)
Win Rate Must Come From Paired Trades
A buy does not create realized profit or loss. Trade PnL only exists after a buy and sell are paired.
def trade_pnls(trades: Iterable[MiniBacktestTrade]) -> list[float]:
    pnls: list[float] = []
    open_cost: float | None = None
    for trade in trades:
        if trade.side == "buy":
            open_cost = trade.amount + trade.fee
        elif trade.side == "sell" and open_cost is not None:
            pnls.append(round(trade.amount - trade.fee - open_cost, 2))
            open_cost = None
    return pnls
This avoids counting open positions as realized win-rate statistics.
Real Run Screenshot
Article 12 continues to use the same integrated example. It reads the equity curve and trades from the article 11 portfolio backtest:
uv run python -m scripts.chapter_examples factor-backtest --source sampleThe real output is:
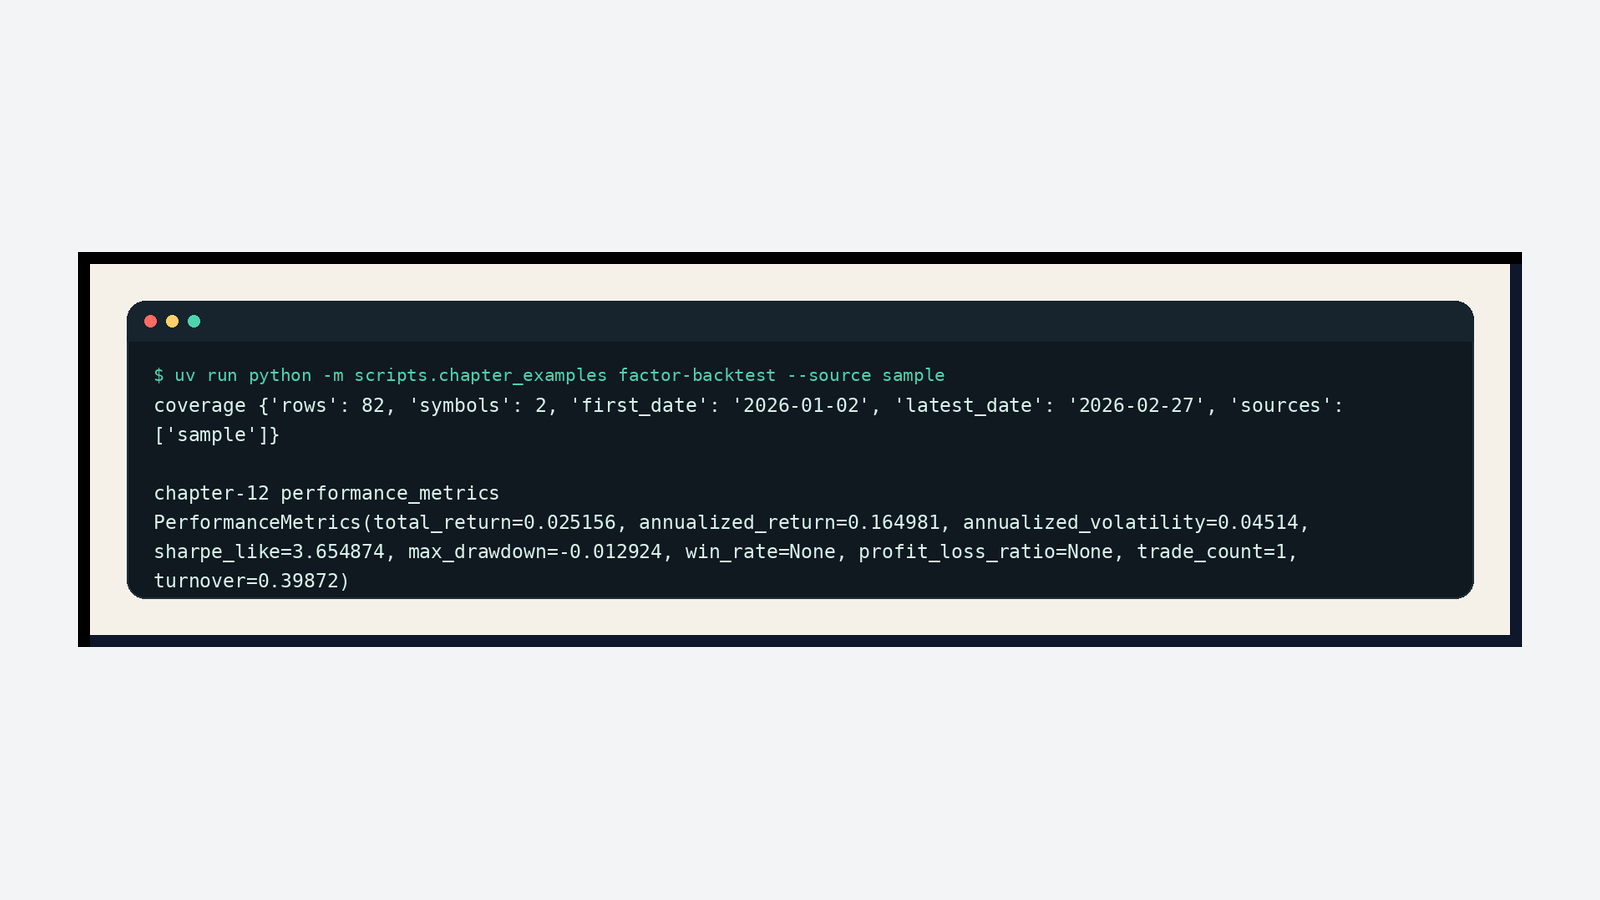
In this sample, total_return is 0.025156, max_drawdown is -0.012924, and turnover is 0.39872. win_rate and profit_loss_ratio are None, because the sample only has buys and no completed buy-sell pairs. This detail matters: without closed trades, win rate should not be fabricated, or the review will mix floating PnL with realized PnL.
Chapter Update And Repository
This chapter adds:
app/performance_metrics.py.- Total return, annualized return, annualized volatility, Sharpe-like ratio, win rate, profit-loss ratio, turnover, and trade count.
tests/test_performance_metrics.py, covering empty curves, trade pairing, and metric summaries.- A real current-mainline screenshot for the metrics example.
- Review notes for total return, volatility, drawdown, win rate, profit-loss ratio, and turnover.
Repository:
https://github.com/ax2/zi-quant-platformCode for this chapter:
git clone https://github.com/ax2/zi-quant-platform.git
cd zi-quant-platform
git checkout chapter-12
uv sync --extra dev
uv run pytest tests/test_performance_metrics.py
The full chapter 12 test suite passes with 176 passed, still with only the existing FastAPI deprecation warning.
Summary
Final return is only one part of a strategy result.
Article 12 turns backtest evaluation metrics into reusable code. Later, when we do parameter search and strategy promotion, we will no longer rely on “the return looks higher”. We will compare strategies with one consistent metric language.
Follow ZiCode on WeChat
If this post was useful, you can follow later updates on WeChat as well.

X / Twitter
Follow @ax2_zicode
Faster technical notes, short thoughts, and new-post alerts are posted on X.

More in this column
- Quant Trading for Programmers 16: Start With A Clear Paper-Trading Ledger
- Quant Trading for Programmers 15: Strategy Promotion Needs A Gate
- Quant Trading for Programmers 14: Save Strategy Candidates As Experiment Records
- Quant Trading for Programmers 13: Add A First Grid Search For Strategy Parameters
- Quant Trading for Programmers 11: From One Stock To A Portfolio Backtest
- Quant Trading for Programmers 10: Run The First Minimal Backtest Loop
- Quant Trading for Programmers 09: From K-Lines To The First Explainable Factor Signal
- Quant Trading for Programmers 08: Clean Raw K-Lines Into Trustworthy Market Bars