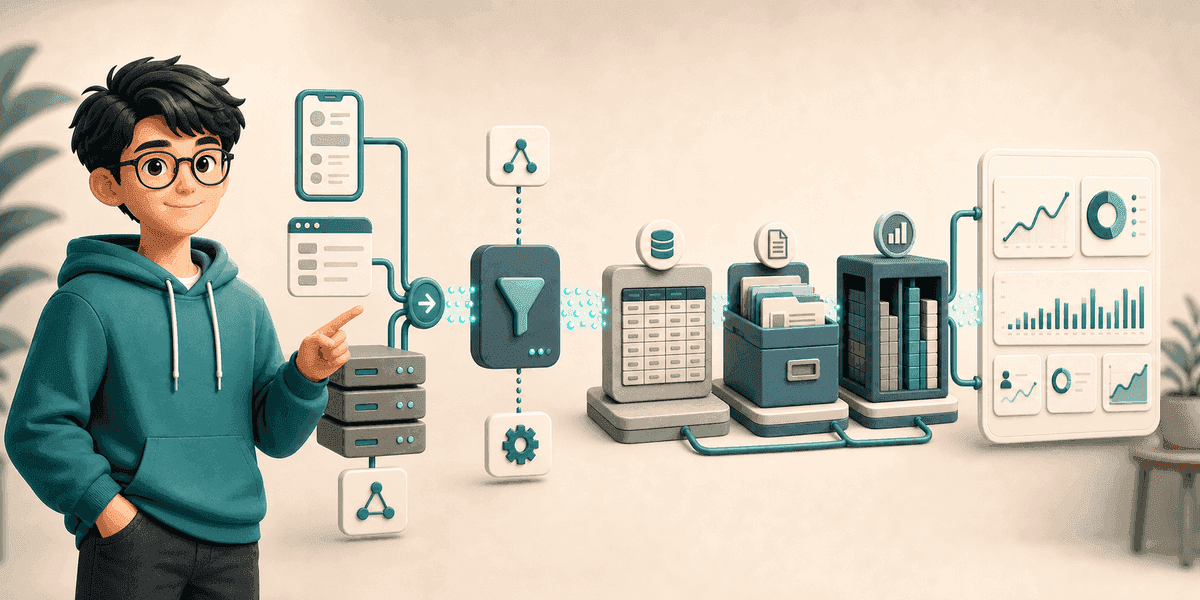
Think About Event Tracking Before the System Is Already Running
When many systems go live, the team says, “Let’s add some logs first and analyze them later.” A few months later, there are indeed plenty of logs, but the important questions still cannot be answered.
Where did users come from? Unknown. How many times was the registration page opened? Unknown. Why did free users fail to convert? Unknown. When an API suddenly gets more traffic, is it because of new users, crawlers, retry storms, or a customer with a broken integration script? Also unknown.
Logs are not event tracking. Logs are usually for engineers debugging software. They say what happened inside the program. Event tracking is for product, growth, operations, risk control, billing, and engineering together. It says what happened to users and the business.
This article is not about one specific project. It breaks down service event tracking as a general engineering problem: what kinds of services need tracking, what to do at different traffic stages, how to choose a database, how to estimate cost, how to evaluate performance, and how to connect a few real business scenarios from user source to analysis result.
What Event Tracking Solves
The most common misunderstanding is treating event tracking as page-view statistics. Page views and unique visitors matter, but they only tell you how many people came through the door. The more valuable questions are usually sharper:
- Which acquisition channel brings users who are more likely to register?
- How long does it take new users to complete their first key action?
- Where do free users drop off before paying?
- Which features are usually used before payment?
- After a release, did the error rate rise in one entry point or across all entries?
- How do high-value users behave differently from ordinary users?
- If an API’s usage goes up, did revenue go up too, and did cost stay under control?
These questions do not need just one log line. They require connecting users, sessions, sources, pages, APIs, orders, features, errors, and costs.
So the core of service event tracking is not “record more”. It is building a traceable chain of facts:
User source -> Page visit -> Signup/login -> Activation -> Feature usage -> Cost -> Payment/retentionIf this chain is broken, more logs only produce local guesses.
Which Services Need Event Tracking
Not every service needs a complex tracking system on day one. The design should depend on service type, business stage, and traffic scale.
| Service type | Most important question | Priority events |
|---|---|---|
| Content site, company site, docs site | Where does traffic come from, and which content drives conversion? | page_view, referrer, utm, entry button, signup click |
| SaaS admin product | Are users activated, and which features do they use? | login, workspace_created, feature_used, invite_sent |
| E-commerce or subscription service | Where does the funnel leak, and why do payments fail? | product_view, checkout_started, payment_succeeded, payment_failed |
| API platform | Usage, success rate, latency, cost, and customer value | api_call, first_api_call, quota_exceeded, billing_usage |
| Internal B2B system | Are key workflows completed, and where do approvals or tasks stall? | workflow_started, step_completed, approval_rejected |
| High-traffic gateway | Peaks, anomalies, region distribution, billing, and risk control | request_sample, error_bucket, rate_limited, billable_event |
Small services should avoid overdesign. A newly launched website does not need a ClickHouse cluster immediately. But it should at least have a stable anonymous_id, page views, key button clicks, and signup success events. Conversely, an API platform with millions of daily calls will soon hurt its business database if it relies only on application logs and ad hoc backend SQL.
Define Events Before Choosing a Database
Database choice matters, but event tracking usually fails first because event definitions are unclear.
A useful event should answer at least four questions:
{
  "event": "api_call",
  "time": "2026-06-29T10:23:45.123Z",
  "user_id": "u_123",
  "anonymous_id": "anon_abc",
  "session_id": "sess_789",
  "source": "web",
  "page": "/pricing",
  "properties": {
    "tool_id": "stock_quote",
    "success": true,
    "latency_ms": 183,
    "credits": 2,
    "plan": "pro"
  }
}
The four questions are:
- Who:
user_id,anonymous_id,account_id,api_key_id - When: keep both event time and server receive time if possible
- Where: page, entry point, client, region, device, service name
- What: event name and business properties
Two details are especially important.
First, do not lose anonymous users. Many conversions start before signup. Without an anonymous_id, traffic source, landing page, and pricing-page visits before registration cannot be connected to the later user.
Second, keep event names stable. If checkout_start, start_checkout, and click_pay_button are mixed together, dashboards will become messy. Event names should have an allowlist, and event fields should have schema versions.
Collection Options
There are roughly four places to collect events.
Frontend tracking is good for page views, button clicks, form impressions, time on page, and client-side errors. It is closest to the user and can capture referrer, UTM parameters, screen, browser, and entry location. But it is unreliable: the user may close the page, the browser may block requests, the network may fail, and frontend data is easy to forge.
Backend tracking is better for signup success, login success, API key creation, orders, API calls, billing, and permission failures. These events must be trusted from the backend, especially payment and billing. Never trust the frontend to say “payment succeeded.”
Gateway tracking works well for API platforms and microservice entrances: path, status code, latency, tenant, key, rate limiting, circuit breaking, and upstream error. Its advantage is consistency. Its weakness is limited business semantics. A gateway knows that an API was called, but may not know what that call means to the business.
Asynchronous tracking is for high-traffic systems. The main flow only pushes the event into an in-memory queue, local buffer, Kafka, Pulsar, or a cloud queue, while consumers write to storage in batches. This prevents database writes from backpressuring user requests. The tradeoff is system complexity: loss, duplicates, out-of-order events, and replay must be handled.
A common responsibility split looks like this:
Frontend: pages and interactions
Backend: business facts
Gateway: request facts
Queue: buffering and batch writes
Jobs: aggregation, repair, and backfill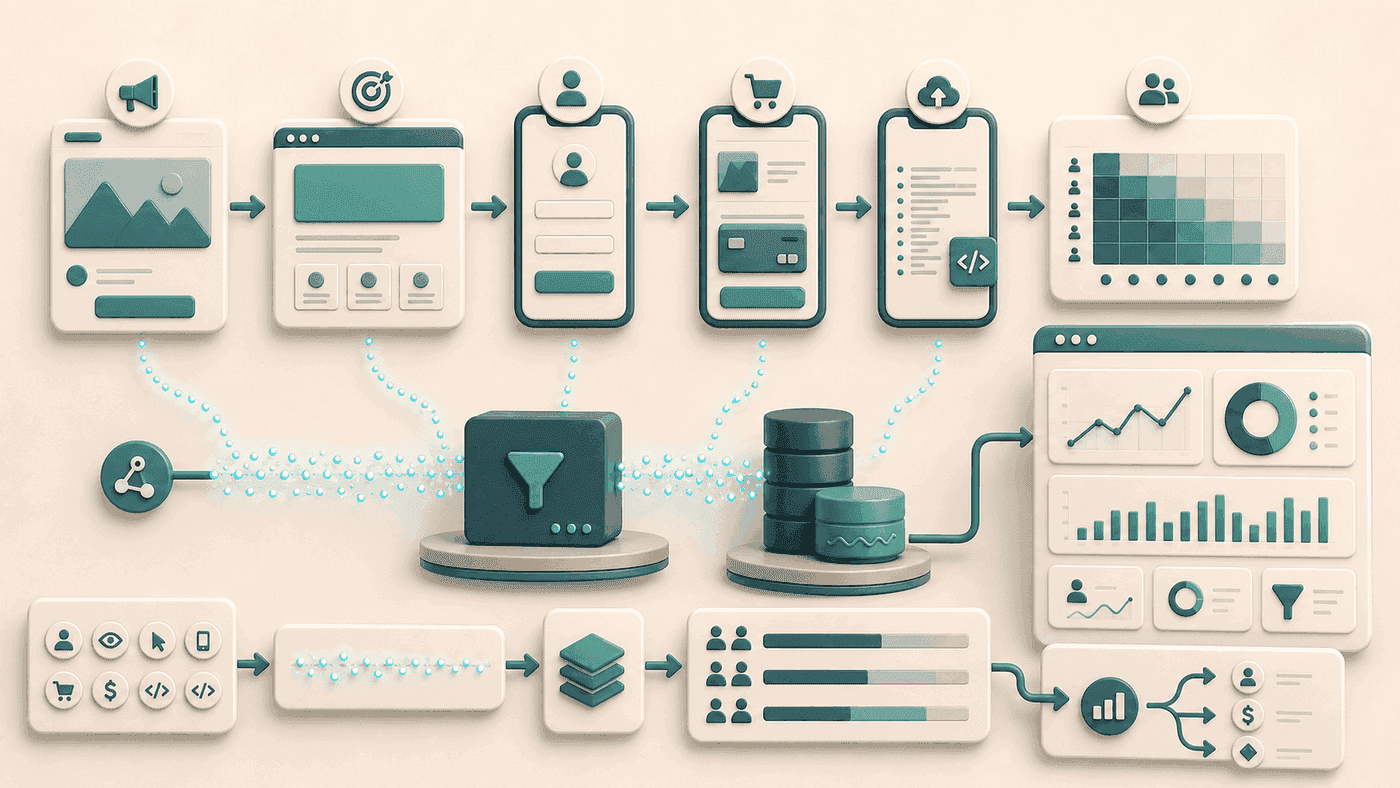
Pitfalls During Collection
Service event tracking is not just inserting one row.
Do not write sensitive information into tracking events. Email addresses, phone numbers, tokens, API keys, payment card numbers, raw prompts, and complete query text all require caution. When analysis is needed, record hashes, lengths, categories, or boolean flags instead of secrets and private data.
Do not let tracking block the main path. Signup, payment, and API calls should not fail because event tracking failed. Common approaches are best-effort writes, async queues, timeout-and-drop behavior, and batch writes.
Do not collect extremely granular events with little value. Scroll, mouse move, and hover events can explode volume quickly. Unless you are deliberately building heatmaps, avoid them at first.
Do not store only raw events without aggregation. If every dashboard scans 180 days of detailed rows, the analytics system will become a database stress test. Common metrics should have daily or hourly aggregates, while detail rows are kept for drilldown.
Do not let properties become a garbage bin. JSON fields are flexible, but each event should have a field dictionary. Otherwise, three months later, the same concept may appear as plan, plan_type, tier, and package.
From Single Events to User Journeys
Event analysis usually has several layers.
The simplest layer is counting and trends:
select date_trunc('day', time) as day, count(*) as pv
from event_logs
where event = 'page_view'
group by 1
order by 1;
The second layer is segmentation:
select utm_source, count(distinct anonymous_id) as visitors
from event_logs
where event = 'page_view'
  and time >= now() - interval '7 days'
group by utm_source
order by visitors desc;
The third layer is funnel analysis:
landing_view -> signup_click -> signup_completed -> first_api_call -> payment_succeededA funnel should not only show total conversion. Split it by channel, device, country, plan, and entry page. If total conversion drops by 20%, it may be caused by a lower-quality acquisition channel, a broken mobile signup page, or a rising payment failure rate.
The fourth layer is cohort retention. For example: among users who completed their first API call, how many still had calls seven days later? This is closer to product usefulness than DAU alone.
The fifth layer is unit economics. API platforms especially need this layer. A customer may have high usage, but if every call produces third-party cost and revenue does not cover it, that growth is not healthy.
Choosing a Database
Common storage options include PostgreSQL, MongoDB, and ClickHouse. Product analytics tools such as PostHog, Amplitude, and Mixpanel are also options. Building your own gives you control over definitions and makes it easier to connect business data. The cost is that you must own data quality, performance, and operations.
PostgreSQL: The Steadiest Starting Point
If your service already uses PostgreSQL, daily event volume is within a few hundred thousand, and most dashboard queries cover the last 7 or 30 days, PostgreSQL is a good starting point.
Its advantage is easy joins with business data. User, order, credit, workspace, and team tables are often already in the same database or nearby systems. JSONB can also carry event-specific properties. PostgreSQL’s GIN indexes support composite-value queries such as JSONB and full-text search, which makes “structured columns plus JSONB extension” a practical design.
But PostgreSQL is not an infinite event warehouse. When writing an event table:
- Partition by time, such as monthly or daily partitions
- Promote frequently queried fields to normal columns instead of putting everything in JSONB
- Add JSONB GIN indexes sparingly, only when properties really need to be queried
- Let dashboards query aggregate tables, not raw detail tables
- Define a detail retention period, such as 90 or 180 days
A steady table design looks like this:
create table event_logs (
  id uuid primary key,
  event text not null,
  event_time timestamptz not null,
  received_at timestamptz not null default now(),
  user_id text,
  anonymous_id text,
  session_id text,
  source text,
  page text,
  referrer text,
  utm_source text,
  utm_campaign text,
  properties jsonb not null default '{}',
  schema_version int not null default 1
) partition by range (event_time);
MongoDB: Usable, But Not Ideal as the Main Analytics Store
MongoDB feels natural for events. Events are JSON-like, fields change often, and writes are simple. MongoDB also has time series collections, where related time and source data can be organized for more efficient time-series storage and queries.
So MongoDB is not impossible for event tracking. It fits these situations:
- Event structure is unstable and still exploratory
- The main use is debugging or audit, not complex funnels
- The team already has mature MongoDB operations
- Queries are often scoped to one user or object, with fewer full-table aggregations
But if you want to do DAU, channel conversion, retention, payment funnels, user segmentation, and API cost trends for a long time, MongoDB will become harder to use. It is not that complex aggregation pipelines cannot do it, but index count, scan cost, and BI integration cost all rise.
In one sentence: MongoDB can be a flexible event store, but it should not be the core analytics database for event tracking.
ClickHouse: The Right Path for High-Traffic Analytics
ClickHouse is a columnar OLAP database designed for append-only large-scale events, logs, time series, and multi-dimensional aggregation. MergeTree, partitioning, and TTL are core capabilities. ClickHouse documentation also recommends partitioning by the same time field used for TTL so expired data can be dropped by partition rather than deleted row by row.
Its strengths fit event tracking well:
- Columnar storage reads only the columns needed by a query
- High compression, especially for repetitive event fields
- Fast aggregation by time, event, user, channel, and region
- High batch-write throughput
- TTL, partitioning, and hot/cold data management support long detail retention
Cloudflare has a representative public case. In a blog post, Cloudflare described using ClickHouse to support HTTP Analytics at millions of requests per second. It has also shared ClickHouse usage in log analytics, customer dashboards, and bot management. These cases show that ClickHouse is not simply “faster PostgreSQL”; it is analytics infrastructure with a different role.
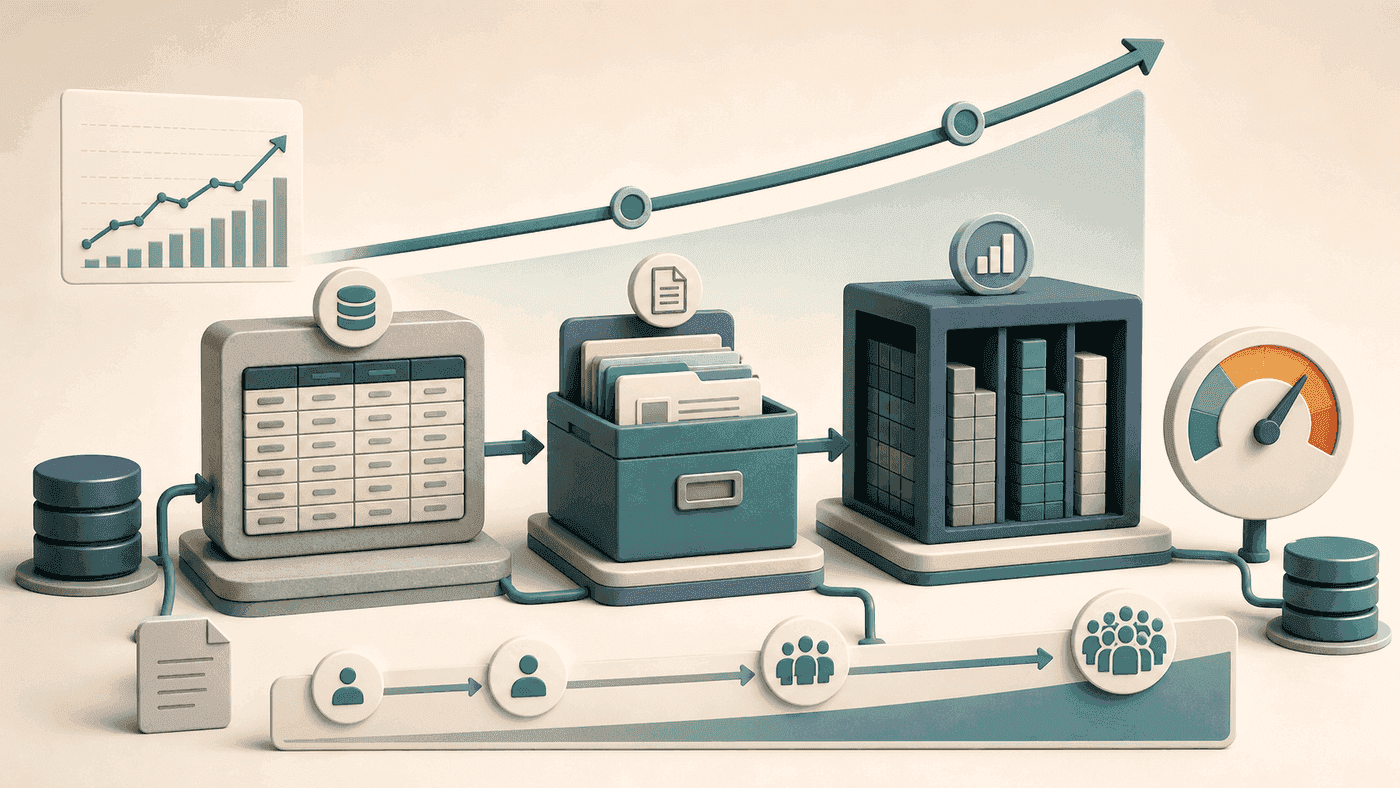
But ClickHouse is not for every stage. It is not good for frequent single-row updates, strong transactions, or replacing the business database. It works best as an analytics database fed asynchronously from PostgreSQL, logs, queues, and services.
A Simple Selection Table
| Stage | Daily events | Recommended architecture | Notes |
|---|---|---|---|
| Starting | 1K - 100K | PostgreSQL single table or monthly partitions | Get event definitions right first |
| Growing | 100K - 500K | PostgreSQL partitions + aggregate tables | Control indexes, aggregate early |
| Fast growth | 500K - 1M | PostgreSQL + ClickHouse sidecar sync | Start validating columnar analytics |
| High traffic | 1M - 5M | ClickHouse for detail analytics, PostgreSQL for business facts | Dashboards should not scan the business database |
| Very high traffic | 5M+ | ClickHouse cluster + queue + tiered storage | Requires real data-platform governance |
These daily-volume lines are practical heuristics, not absolute thresholds. If events are narrow and queries are simple, PostgreSQL can last longer. If each event has large properties and dashboards scan 180 days frequently, even a few hundred thousand daily events may become painful.
Estimating Cost
Event-tracking cost is mainly determined by five variables:
Daily events × event size × retention period × replica count × query complexityIn PostgreSQL, one event with JSONB, row overhead, and indexes can roughly be estimated at 1KB to 3KB. In ClickHouse, compressed size may be 200B to 800B, depending on field design and repetition.
For 500,000 events per day:
| Storage | Per-event estimate | Monthly detail | 12-month retention |
|---|---|---|---|
| PostgreSQL | 2KB | About 30GB | About 360GB |
| PostgreSQL with index expansion | 4KB | About 60GB | About 720GB |
| ClickHouse compressed | 500B | About 7.5GB | About 90GB |
This counts only detail rows. It does not include backups, replicas, aggregate tables, WAL/binlog, or object-storage archives. A safer budget adds a 1.5x to 2x buffer.
For self-hosted ClickHouse, a single node with 4-8 vCPUs, 16-32GB memory, and a few hundred GB to 1TB SSD is often enough for early validation and medium-scale analytics. At millions of daily events or more than one year of detail retention, replicas, backups, hot/cold tiering, and query isolation should be planned seriously.
Evaluating Performance
Do not only benchmark writes. Event systems usually fail when writes, queries, aggregation, and cleanup happen at the same time.
I would watch these metrics:
- Write latency: whether tracking slows down main business requests
- Write throughput: events per second, batch size, failed retries
- Query latency: P50 and P95 of common dashboards
- Aggregation time: whether daily jobs finish inside their window
- Storage growth: daily new data and index ratio
- Data delay: how long after event generation it appears in dashboards
- Data quality: duplicate rate, loss rate, missing user IDs, invalid event names
A simple acceptance target can be:
| Metric | Small/medium service target | High-traffic service target |
|---|---|---|
| Main-path tracking overhead | P95 under 10ms, failures do not affect business | Main path only enqueues, P95 under 3ms |
| Frontend event visibility delay | 1-5 minutes | Within 1 minute or near-real-time |
| Daily aggregation job | Finish within 30 minutes | Incremental aggregation in minutes |
| Common dashboard query | P95 under 2 seconds | P95 under 1 second |
| Detail query window | Default 7-30 days | Long windows supported by ClickHouse |
One easily overlooked point: event growth is not always linear. Normal business growth is one case. A buggy SDK, client retry storm, debug events left on, or crawler traffic is another. The tracking system should be able to degrade gracefully: sample DEBUG events, drop low-priority events, and rate-limit events by user.
Case 1: A Content Site Tracking Signup Conversion
Suppose you run a technical content site. The goal is not just article views, but product registrations.
Event design:
| Stage | Event | Key fields |
|---|---|---|
| Source | page_view | anonymous_id, utm_source, referrer, slug |
| Reading | article_read | scroll_depth, read_seconds, slug |
| Click | signup_click | location, slug, button_type |
| Signup | signup_completed | user_id, anonymous_id, method |
| Activation | first_key_action | user_id, action, hours_since_signup |
Analysis path:
Ads/search/social -> Article page -> Signup button -> Signup completed -> First key actionPossible findings:
- Search traffic has the largest PV, but average signup conversion
- A deep technical tutorial has modest PV but high conversion
- Mobile has many signup clicks but few completed signups, indicating a mobile signup issue
- One channel brings fast signups but low activation, suggesting low-quality traffic
The optimization actions become clear. Instead of “write more articles”, move high-conversion articles forward, fix mobile signup, and adjust acquisition channels.
Case 2: An API Platform Tracking Cost and Revenue
An API platform is dangerous if it only watches call volume. More calls may mean higher cost. If there is no revenue or retention, growth can become loss.
Event design:
| Stage | Event | Key fields |
|---|---|---|
| Signup | signup_completed | user_id, plan, utm_source |
| API key | api_key_created | user_id, key_type |
| First call | first_api_call | user_id, tool_id, signup_to_first_call_hours |
| Call | api_call | user_id, api_key_id, tool_id, success, latency_ms, cost, credits |
| Quota | quota_exceeded | user_id, plan, requested_action |
| Payment | payment_succeeded | user_id, amount, plan, calls_before_pay |
Core analysis:
select
  tool_id,
  count(*) as calls,
  sum((properties->>'cost')::numeric) as cost,
  sum((properties->>'credits')::numeric) as credits,
  avg((properties->>'latency_ms')::numeric) as avg_latency
from event_logs
where event = 'api_call'
  and event_time >= now() - interval '1 day'
group by tool_id
order by calls desc;
This analysis can answer:
- Which tools are used heavily but do not convert?
- Which tools have high raw cost and need pricing changes?
- Is time to first call too long for free users?
- Is first-call success low because parameters are hard, docs are unclear, or third-party providers are unstable?
For an API platform, “request facts” and “business behavior” should be separated. Request facts can come from gateway or backend and must be accurate. Product events explain why users reached that point.
Case 3: A Subscription Service Tracking the Payment Funnel
Subscription services should not only watch successful payments. The path before payment is more important.
Event chain:
pricing_view -> plan_select -> checkout_started -> payment_succeeded/payment_failed -> subscription_renewed/subscription_cancelledKey fields:
current_planselected_planpricepayment_methodfailure_reasoncountrydevice_typeentry_point
Do not calculate only one total funnel. Split by:
- Mobile and desktop
- Country or region
- Entry point, such as home page, docs, or usage-limit reminder
- New users and returning users
- Monthly and annual plans
A common finding is that plan_select -> checkout_started converts well, but checkout_started -> payment_succeeded performs poorly. The problem is often not the pricing page, but the payment path: unsupported payment method, failed 3DS verification, excessive billing-address requirements, or unclear error messages.
Evolution Strategy
I prefer a four-step evolution.
First, collect only core events: page view, signup success, login success, key feature usage, payment success, and API call. Get definitions correct before chasing event count.
Second, complete the identity chain. Anonymous user, logged-in user, account, team, and API key should connect. Without identity, funnel and retention analysis are unstable.
Third, build aggregate tables and dashboards: DAU, signup conversion, first key action, payment conversion, feature usage, call success rate, and cost trend. Business users should not need engineers to run SQL every day.
Fourth, introduce an analytics database. When PostgreSQL can no longer handle long-window detail scans, synchronize events to ClickHouse. By then, event definitions are stable and table design is easier to get right.
A healthy tracking system should start simple but grow smoothly:
PostgreSQL raw events
  -> PostgreSQL partitions + aggregate tables
  -> PostgreSQL + ClickHouse sidecar analytics
  -> ClickHouse for detail analytics, PostgreSQL for business facts
Event Tracking Is an Agreement Between Product and Engineering
Service event tracking is not a product manager writing an event spreadsheet, nor an engineer adding a few log lines. It is closer to an agreement: how we define user behavior, success, cost, and one truly valuable use.
It does not need to be heavy at the start. For a small service, ten accurate core events are more useful than one hundred chaotic events. When traffic grows, queues, partitions, ClickHouse, and storage tiering can come later.
What really matters is that after the system goes live, the team can keep answering these questions:
- Where did users come from?
- What did they do?
- Where did they get stuck?
- Which behaviors generated revenue?
- Which calls consumed cost?
- After a change, did the result become better or worse?
If the system can answer these questions, event tracking has started to create real value.
References
- Cloudflare: HTTP Analytics for 6M requests per second using ClickHouse
- Cloudflare: Log analytics using ClickHouse
- ClickHouse Docs: Manage data with TTL
- ClickHouse Docs: Table partitions
- PostgreSQL Docs: GIN Indexes
- MongoDB Docs: Time Series Collections
- PostHog Docs: Self-host PostHog
Follow ZiCode on WeChat
If this post was useful, you can follow later updates on WeChat as well.

X / Twitter
Follow @ax2_zicode
Faster technical notes, short thoughts, and new-post alerts are posted on X.